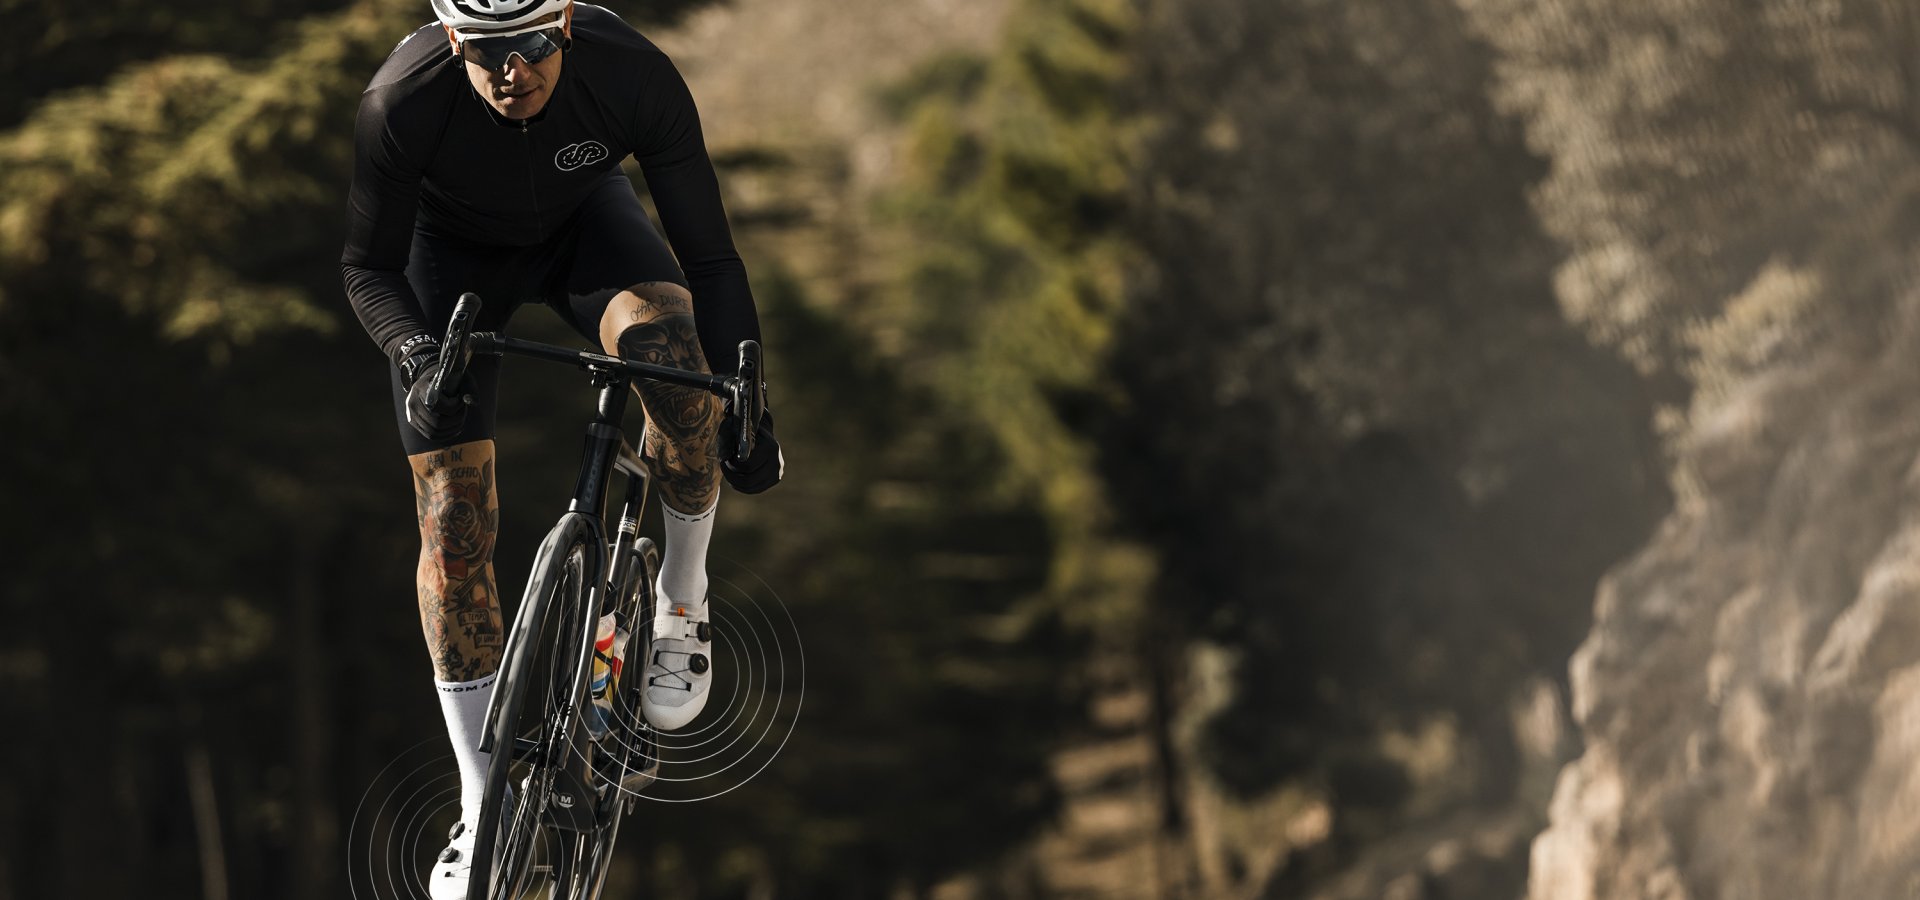
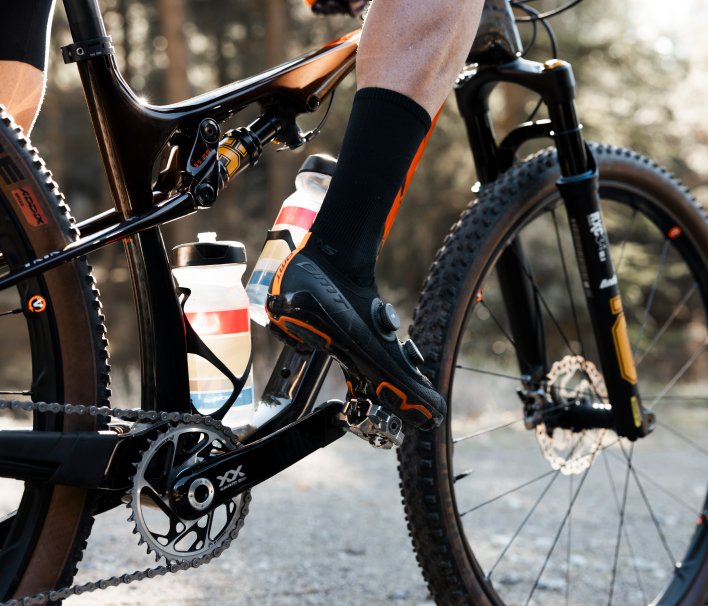
What data is captured by your LOOK Power Meter Pedals?
LOOK Power Meter Pedals provide a full range of data that will enable you to analyse your pedal stroke in detail, improve your performance and make progress with every ride.
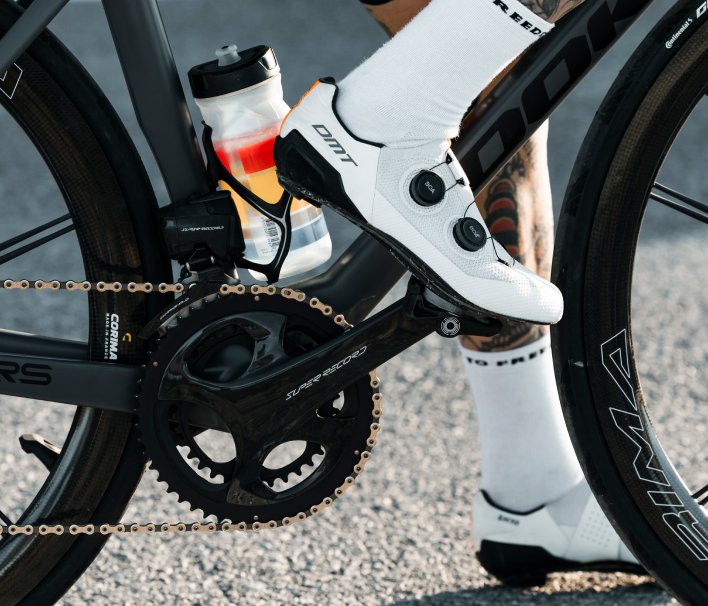
Power
Our Power Meter Pedals provide you with a reliable and highly accurate indication of the effort you produce to propel your bike. This measurement allows you to adapt your training programme to improve your performance and monitor your progress. LOOK Power Meter Pedals give you access to a range of power information which include but are not limited to:
-Instantaneous power
-Average and maximum power
-Maximum average power over 20 minutes
-Normalized power (NP®)
-Power zones (Z1 to Z7)
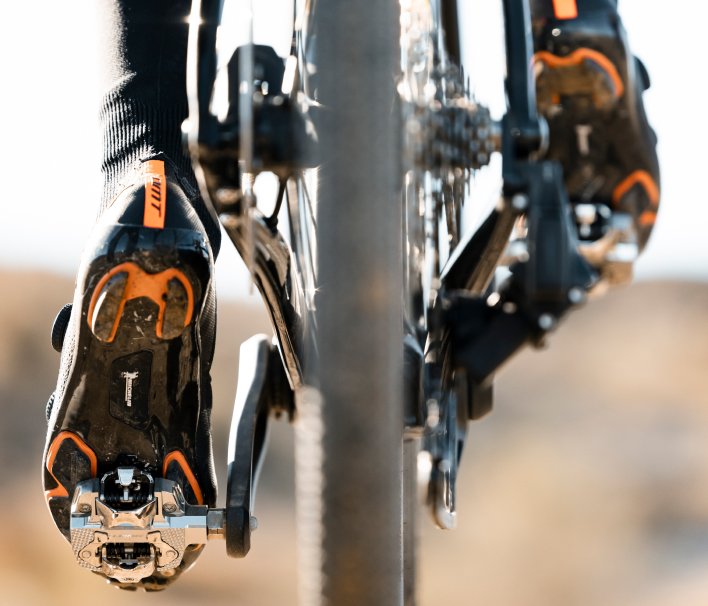
Balance Right Leg/Left Leg
Balance is indicated as a percentage and reflects the power generated by each of your legs.
The LOOK Power Meter Dual pedals allow you to measure the power generated by each leg separately (rather than providing an estimate like a cranksets power meter, or hub sensor).
An equal balance between the two is generally the goal.
An imbalance can reflect changes in your physical condition, a state of fatigue or even a muscular imbalance. Knowing your own left/right balance and how it evolves allows you to get to know yourself and work specifically to prevent injury and optimise your pedal stroke.
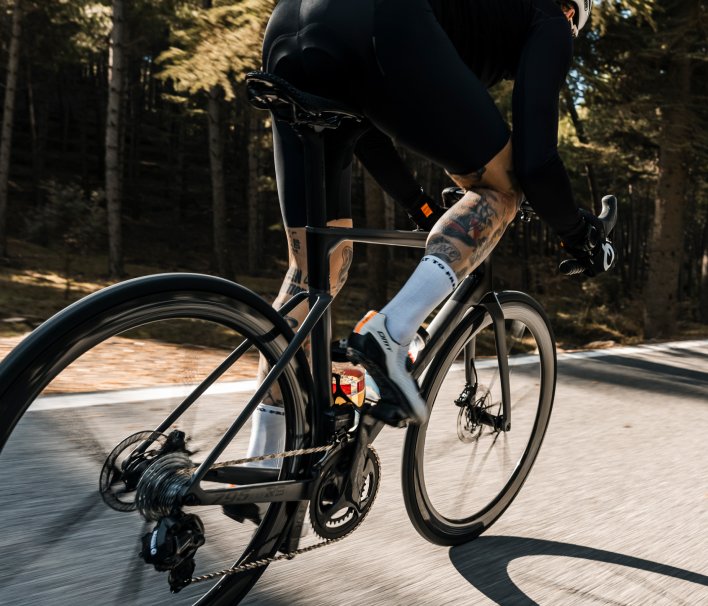
Cadence
Cadence indicates the number of complete revolutions made by the pedals in one minute and is displayed as RPM.

Cycling Dynamics
Torque Effectiveness (TE)
Torque Effectiveness represents the percentage of useful force within the total force produced during the pedal stroke.
TE assesses the quality of each pedal stroke by measuring the amount of force applied that is used to move the bike forward, as opposed to force that is wasted or misused.
A higher percentage indicates a more efficient use of the power produced by the rider, while a lower percentage may indicate inefficiencies in the pedal stroke (such as when the rider lifts the leg to pass top dead centre). This measurement is useful for optimising pedalling technique and improving overall performance.
Pedaling Smoothness (PS)
This refers to the measurement of the regularity and consistency of the force applied during the pedalling cycle.
A high PS indicates smooth, even pedalling, while a low PS may indicate irregular pedalling with variations in the force applied with each turn of the pedal. PS is useful for evaluating and improving pedalling efficiency and comfort.
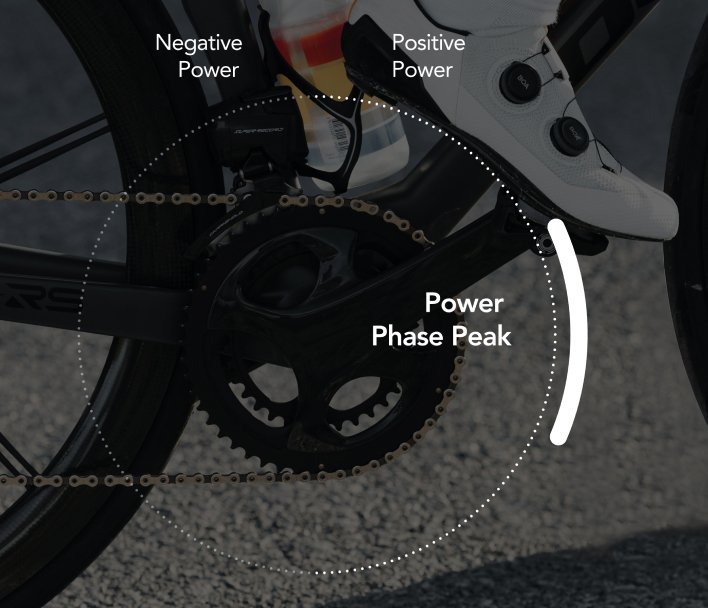
Power Phases
Power Phases identify the moments in the pedaling cycle when you apply force that truly contributes to propulsion, as well as the zones where your power output reaches its peak.
Analyzing this data highlights the quality of your pedaling motion, detects potential imbalances between your left and right legs, and helps optimize energy transfer. The result is smoother, more efficient, and higher-performing pedaling.
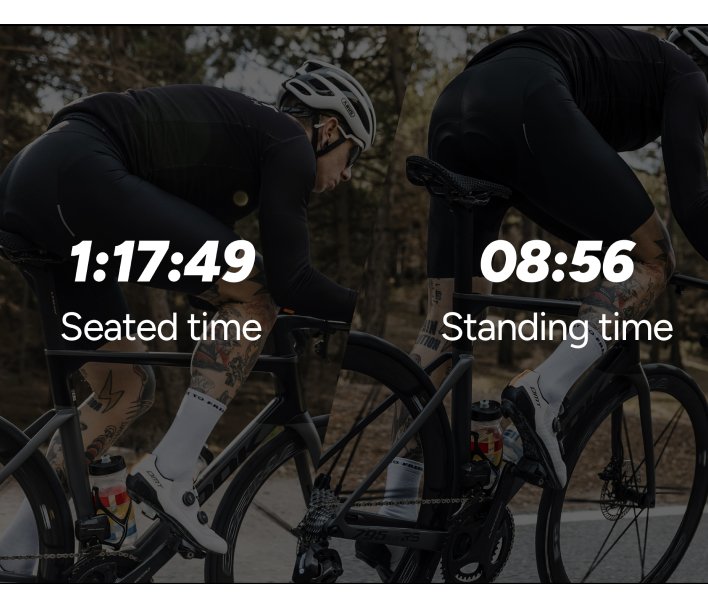
Seated / Standing Time
With our power meter pedals LOOK Cycle, every second spent seated or standing out of the saddle is accurately detected and recorded during your rides.
This data reveals your pedaling style and how you manage your effort. In races or training sessions, tracking your seated/standing time helps you better understand how you tackle climbs, accelerations, and sprints.
You can also visualize the impact of each position on your power output, allowing you to fine-tune your sessions and improve your efficiency.
Other parameters measured :
- Intensity Factor (IF®) :
Represents the relative intensity of an effort in relation to an individual's aerobic capacity. It is calculated as a function of the average power of the effort in relation to the athlete's theoretical maximum power.
- Training Stress Score® (TSS®) :
Evaluates the training load, taking into account both the intensity and duration of the physical effort.
- Functional Threshold Power (FTP) :
FTP is the highest power that a rider can maintain in a quasi-steady state without fatigue. It is used as a reference to determine training zones in cycling.
- Energy consumption